FractaLog

a non-linear space for students of chaos and fractals....

Thursday
Jun042009

To Boldly Determine a Fractal Dimension

It happens very quickly, and is very easy to miss, unless one is either an inveterate fractalogist or Vulcan, or both.

In the eminently entertaining Star Trek movie just released there is a scene of young Spock's school which appears to be a cavernous room with a floor made up of indented hemispherical shells (as if you were on the inside wall of a very large pimple ball). of each "pimple" while a Vulcan student in each "pimple" listening to a lecture, or reciting a lesson while Mathematical expressions are illuminated on the walls

The film takes us for a brief visit to a few of these math-pimples. In one, a pointy-eared student begins his recitation:

The dimensionality equals the log of N...

The statement is not completed, but clearly this is the beginning of the expression for the Hausdorrf-Besicovitch dimension:

d = Log(N)/log(s)

This expression has many different variants (I am guessing that this is the one used in Vulcan grade schools), and can be used to easily calculate the dimensions of deterministic fractals. So, e.g., the Cantor set weighs in at a dimension of log(2)/log(3) = 0.6309..., while the Sierpinski Carpet is a more robust log(8)/log(3) = 1.8928...

Combined with clever statistical counting techniques, the dimension of random, and even naturally-occurring fractals can also be determined. The boundary of regular Brownian motion has a dimension of 4/3 = 1.33, while the surface of the human brain has a dimension of approximately 2.79.

In case you're wondering what naturally occurring object your brain most closely resembles, note that the dimension of a typical piece of broccoli is 2.66

See this list of fractals sorted by Hausdorff-Besicovitch Dimension for more!

In the lists that regularly appear comparing the mathematical performance of US school kids vs. children in other countries, thank goodness Vulcan is not listed. Not only do they all know about the H-B dimension, they instinctively know the definition of a fractal: an object whose Hausdorff-Besicovitch dimension is greater than its topological dimension.


Live long and prosper, measuring your fractals wherever you find them.

Friday
Apr242009

Damn Yankees' Stadium

How Does a Baseball Fly?I'm loving the controversy swirling around the opening of the new Yankees Stadium.  The number of home runs hit is already far exceeding the pace of past seasons, leading to the inevitable pointing of big, angry New York fingers at those who are at the front lines, or at least at the foul poles, of stadium building.

That would be the wind modelers, of course.

Give them a Bronx break. The complexities involved in predicting airflow over such a complicated shape are staggering.  Wind tunnel simulations using scale models of the stadium can only provide so much information - mostly about macroscopic responses of structural elements to wind gusts.  (Just think about  how tiny the balls and bats would have to be in order to simulate the home run frequency.)

The new stadium has the same dimensions as the one just demolished, so the homer explosion must be due to the different wind patterns that exist.  The outside shape of the stadium, it's different compass orientation, concourse dimensions, angle of the seats, are just a few of the possible design suspects  leading to the homer fest currently playing out. 

Of course, knowing why a baseball flies the way it does is an essential component of any prediction.  It is certainly not clear that wind modelers know this physics, or whether they talk to those who do. Maybe if they read How does a baseball fly? the baseballs would not be flying the way they are in the Bronx.  This site was put together by Rowan Williams Davies & Irwin Inc, a "wind engineering and microclimate consulting firm" that have modeled wind conditions at  a number of American League parks.

Major League Baseball takes HR's very seriously because of the potential ratings they produce. But statisticians are even more serious, trying to come up with a way to compare the HRPF (Home Run Park Factor) of different ballparks in an effort to determine which one is the most favorable for hitting home runs.  Check out the analysis of Greg Rybarczyk, who leaves no seam unstitched in his quest for quantitative surety.  Rybarczyk uses Hit Tracker, a true baseball junkie's website that contains the parameters of all home runs hit, allowing for the total flight distance to be calculated.  Let him describe his obsession...

Hit Tracker in its usual form uses observations of hit outcomes (landing point, time of flight) to derive the hit’s initial parameters (Horizontal Launch Angle or HLA, Vertical Launch Angle or VLA, and Speed off Bat or SOB, with spin assumed to be a function of these factors). But, with a few lines of code added, it becomes "Hit Whacker," using HLA, VLA, SOB and atmospheric inputs to generate a hit’s outcome. With this capability, we can create a procedure for assessing how easy or hard it is to hit homers in any park.

To cover the range of possible batted balls that could become homers, I created a “test set” of trajectories, representing 45 different HLA’s (every two degrees from foul line to foul line), 41 different VLA’s (15 to 55 degrees) and 26 different SOB’s (95 to 120 mph). That’s 47,970 different fly ball paths! I ran this complete test set in each park, in that park’s actual altitude, in the park’s average game time temperature from 2002-06, with no wind (I’ll describe how to account for different winds shortly). The trajectories were evaluated as “home run” or “not home run”, and the results were compiled.

Hit Tracker sample output. Click to enlargeI won't list the results here, which are listed by Rybarczyk at the Hardball Times site. These results date from 2007, so the new Yankee Stadium is not yet analyzed.

Now a lot of HR's are not a bad thing, of course. Hailing from Philly, I can tell you that Ryan Howard's blasts sound like a home run should. When the balls heave his bat, it's almost possible to imagine that his swing created the vortex that carried the ball along with it into the upper deck in right field.
Let's not forget that Citizen's Bank park was roundly blasted for the first few years of operation because of its too-friendly confines for hitters. Pitchers were scared of signing with the Phils because of the imminent danger to their ERA and subsequent contract potential.

How did this turn out? With the correct set of starting and relief pitching, the Phillies won the World Series in 2009 - thank you very much.

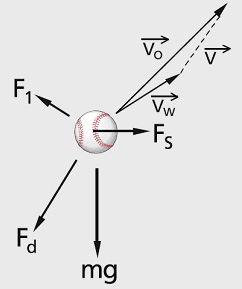
And now, back to Yankee Stadium.  Even the best modelers are often way off base in their predictions because of the chaotic nature of weather and climate. In the ballpark case, it's hard to get more non-linearly complex than the interaction of the vector field of the wind velocity and the spinning baseball.  Perhaps the best answer to why the new park is such a Home Run zone is a blog comment posted by one of the Bleacher Bums.  It is an analysis of Hemingwayian economy and precision: The Middle Relievers S*CK.

Tuesday
Nov042008

538 and Counting

Well , it's finally here, and not a moment too soon. I haven't posted in months. I'll blame some of the procrastination on today's election. Like many former able-bodied workers, I have spent countless hours watching the web wires for the latest info on the moose hunter of all elections.

One place where I've probably spent 538 hours or so is at fivethirtyeight.com - a meta-meta-polling site that claims to present "electoral politics done right."

Named for the total number of possible electoral votes, FiveThirtyEight.com is the creation of Nate Silver and Sean Quinn, who have developed a unique methodology for polling analysis:

  1. Many polls are used to produce a weighted average. The weights are based on a reliability index determined by that pollster's historical track record, the poll's sample size, and the recentness of the poll.
  2. A regression estimate based on the demographics in each state is used to account for outlier polls
  3. An inferential process allows states that have not been polled recently to have their results modified , effectively makeing them "currrent"
  4. The election is simulated 10,000 times "in order to provide a probabilistic assessment of electoral outcomes based on a historical analysis of polling data since 1952. The simulation further accounts for the fact that similar states are likely to move together, e.g. future polling movement in states like Michigan and Ohio, or North and South Carolina, is likely to be in the same direction."

See the site for a much more thorough description of their methodology.

And especially visit it to see the display of results, particularly of the simulated elections.

Which is why I'm posting now, at 1:20 AM EST on November 4th. The latest simulations has Obama winning in 98.1% of the model elections, which ultimately leads to a prediction of Obama getting 52% of the vote to McCain's 46.1%. The electoral breakdown is predicted to be 346.5 to 191.5 for Obama (I could not find where the 0.5 electoral vote comes from)

Naturally I am as interested in the accuracy of these predictions as I am interested in the outcome. I will post an update to this piece as soon as the final numbers are tallied, to check the reliability of FiveThirtyEight.


Monday
Jun232008

Randomness & God: Templeton Prize 2008

michal_heller.jpgThis past march, Michal Heller was awarded the 2008 Templeton Prize, an honor that groups him with other prize winners as "entrepreneurs of the spirit"— defined by John Templeton as  outstanding individuals who have devoted their talents to those aspects of human experience that, even in an age of astonishing scientific advance, remain beyond the reach of scientific explanation. (more)

I have written before about past winners, and of research sponsored by the Templeton Foundation. Yet I have not found explicit writing that attempts to join together the separate strands of science and the divine through the prism of chaos until I read some of Heller's works. This may be because of his very obvious dual hats: Heller is both a cosmologist and Catholic priest, who managed to thrive in communist Poland.

Heller is really interested in the ultimate beginnings of everything. His work and speculation must necessarily include theology because his target is the start of everything before there was a Start to Everything:

Various processes in the universe can be displayed as a succession of states in such a way that the preceding state is a cause of the succeeding one… (and) there is always a dynamical law prescribing how one state should generate another state. But dynamical laws are expressed in the form of mathematical equations, and if we ask about the cause of the universe we should ask about a cause of mathematical laws. By doing so we are back in the Great Blueprint of God's thinking the universe, the question on ultimate causality…: "Why is there something rather than nothing?" When asking this question, we are not asking about a cause like all other causes. We are asking about the root of all possible causes.

Click to read more ...

Tuesday
Jun032008

The Long and Short of Wikiprediction

583047-1625220-thumbnail.jpg
The Problem with Wikipedia. (Click to  enlarge)
In what may be a self-organized example of Occam's Razor, consider the case of reliability of Wikipedia articles.

Recently, Joshua E. Blumenstock of UC Berkeley performed a statistical analysis of 1000's of wikipedia pages, looking for predictors of quality articles. (Where "quality articles" was taken to be featured articles. These articles are given this rating by Wikipedia editors, using specific criteria.   As of this posting, there are approximately 2000 featured articles out of over 2.4 million wikipedia articles.)

In his paper Automatically Assessing the Quality of Wikipedia Articles Blumenstock describes the search for correlation between "featuredness" and a a wikiload of possible variables. The variables included surface features (e.g. # of characters, words, one-syllable words), structural features (e.g. links , images, tables), a variety of readability metrics (e.g. Gunning Fog, Coleman-Liau Index), and part of speech tags (e.g. nouns, past participles, perterites).

He needn't have looked so deeply. It turns out that word count alone is an incredibly potent predictor. Amazingly, Blumenstock found that whether an article had greater or less than 1830 words was all that was needed to predict whether an article was featured with 97% accuracy!

Now why is this?

Click to read more ...

Friday
May162008

Cabbage Leaves and Temporal Fractals

583047-1616245-thumbnail.jpg
Fractal tumor on Wild Cabbage Leaf
I have always considered fractals in time to be related to self-similar music (such as a nested fugue), or just a plain-old self-similar time-series, such as stock market fluctuations, or the corn price fluctuations at the Chicago Mercantile Exchange, whose fractal nature was first noted by Mandelbrot.

Now there's a different way to consider time-fractals - proposed by Carlos Escudero and colleagues of the Institute for Mathematics and Fundamental Physics in Madrid, in their Dynamic Scaling of Non-Euclidean Interfaces

Escudero "performs calculations of the dynamic scaling (how a surface changes in space and over time at several different scales) of growing structures, such as the kind of semiconductor films used in the microchip industry where, even under the most carefully controlled of conditions, rough (non-Euclidean) geometries can exist. He found that the moment-by-moment behavior of the surfaces are strongly effected by the fractal geometry."

Click to read more ...

Thursday
May152008

Cephalapod Fractals

583047-1573110-thumbnail.jpg
Complex Suture
Steve LaMonte, a student in my Fall 2007 version of Chaos and Fractals, has noted the fractal-like shapes that are formed by suture lines in ancient cephalopods. He points out the correlation between fractal structure and the ability of the cephalopod to withstand extremes of water pressure. He writes:

One often pictures fractals as consisting of pretty pictures generated by computer programs, but they are quite prevalent in nature. A notable example can be found in the fossils of ancient cephalopods, specifically nautiloids and ammonoids. Nautoloids and ammonoids are the ancient ancestors of modern squids, octopi, and the nautilus. The ancient organisms looked like modern squids and octopi with shells, some elongated and some coiled like a snail. These shells had internal chambers that the organism filled with gas for buoyancy. Each chamber is separated by a wall, or septa. The contact line between the septa and the inner shell wall is called a suture line. The structure of the suture line determines how well the organism can resist water pressure and adjust its buoyancy. The evolution of suture lines follows an increasingly fractal-like pattern from straight sutures to highly undulated sutures. In complex sutures, the dips and folds in the undulations are called lobes and saddles, respectively.

Click to read more ...

Sunday
May112008

Watt Were They Thinking?

cokemachine.gifOr rather, what in the world goes on when a writer for almost any type of publication - whether mainstream or not - writes about anything that remotely touches on science?

Often times what comes out instead is "science," a stream of misapplied, poorly understood concepts. Maybe it's writing for deadlines, or maybe it's just the overall scientific illiteracy that grips many, but there is no doubt that the world needs more reporters that know the very basic scientific ideas. Otherwise we are all faced with an every growing body of articles and blog posts that will only reinforce the already shaky scientific foundation that many apparently have. (I have already noted recent media errors in articles on friction and gravity.)

My latest gripe? The May 12, 2008 issue of Newsweek contains a very positive article about students at MIT trying to lower energy costs wherever "energy hogs" exist, with a major hog - your typical vending machine - one of the main targets of their energy-waster-busters attention. Unfortunately, the amount of energy consumed by an average vending machine is incorrectly stated. According to Newsweek "The average soda dispenser consumes 3,500 kilowatts a year." As anyone who actually pays utilities should know, a kilowatt is a rate of energy use (it's 1000's of joules/sec). The actual unit of energy used is then found by multiplying the Rate of energy use x running time, i.e. the kilowatt-hour (kW-hr). One kW-hr is the amount of energy used by a device running at a rate of 1 kW for 1 hour. This energy amount is typically how your electric bill is determined by the electric company that services your home. The price per kw-hr will vary depending on the area of the country, the source of the electric company's energy, and time of year. Current rates for my area are approximately 17cents/kw-hr.

Click to read more ...

Thursday
May082008

Where the Hell Are They? Now pass the pasta...

583047-1556276-thumbnail.jpg
Klaatu barada nikto
One of the great lines in all of 20th century science was uttered over lunch by Enrico Fermi. In a discussion of the possible likelihood of many advanced civilizations in our galaxy, Fermi said something to the effect of "well, where the hell are they."

I may have taken some liberty in the way Fermi expressed himself, but there's no doubt that Fermi's questions is one of the more provocative off-the-cuff statements ever made because of the response that it generated, including immortalization as a named dilemma: The Fermi Paradox

In 1961, approximate 10 years after Fermi's lunch-time query, Frank Drake developed an equation that he used to predict the number of advanced civilizations in our galaxy. Upon reading about the Drake Equation many years ago, I was struck by its simplicity and its audacity. Here it is in its full glory.  (Read all about the parameters here

N = R* fp ne fl fi fc L


The equation consists of a chain of probabilities, all multiplied together in the fashion of the probability of a string of independent events. Depending on the values of the individual probabilities, estimates of the average number of advanced civilizations/galaxy range from several thousand to less than one.

Click to read more ...

Thursday
Apr242008

An Absorbing Collision

583047-1516294-thumbnail.jpg
CO2-collision/absorbtion
Belief in global warming, and especially the causes of GW (if one believes the data) depend crucially on modeling. The physics of atmospheric gases-solar radiation interactions, especially those involving carbon-dioxide molecules, is of major importance because the increase of CO2 is often quoted as a correlate to warming. The story is basically that CO2 absorbs some of the infrared radiation (IR) streaming to the earth from the sun, and reflects the rest back.

Just how much is absorbed? The answer to this question is a crucial one. Until recently, the basic physics of light absorption by gas molecules, though pretty well understood, doesn't get the amounts of IR absorption correct for atmospheric CO2. Is this a failure of physics, or the model used?

Get serious. Of course it's not the physics. To paraphrase, it's the model , stupid. Physicists decide what goes into a model, and then the physics (in the form of fundamental laws) takes over, yielding the model prediction.

Click to read more ...